Published on
June 14, 2024
by
Julia Merkus, MA
Revised on
May 19, 2025
Internal validity refers to the extent to which a research study’s design and methods minimize the likelihood of alternative explanations for the observed effect between variables.
In other words, internal validity addresses the question: “Is the observed effect or relationship likely due to the independent variable (the variable being manipulated) and not due to other factors?”
A high level of internal validity means that the study’s conclusions are likely to be reliable. It’s one of the most important types of validity in research.
Internal validity exampleA fitness instructor wants to investigate whether a new exercise program improves cognitive function in adults. The study consists of 20 participants, who are randomly assigned to either a treatment group or a control group.
The treatment group participates in the new exercise program for 3 months
The control group does not participate in any exercise.
The participants’ cognitive function is assessed using a standardized test at the beginning and end of the 3-month period.
However, during the 3-month period, the participants are also encouraged to eat a healthy diet as part of their overall health and wellness. The researcher doesn’t control for this extraneous variable, so it’s possible that any changes in cognitive function are due to the diet rather than the exercise program. The study has low internal validity
TipWhile not a substitute for expert opinion, generative AI tools like QuillBot’s AI Chat can help you think through possible threats to internal validity in your own or others’ research.
Published on
June 13, 2024
by
Julia Merkus, MA
Revised on
May 19, 2025
Face validity is a type of validity that refers to the extent to which a research instrument, such as a survey, questionnaire, or test, appears to measure what it is supposed to measure.
In other words, face validity is concerned with whether the instrument looks like it is measuring what it claims to measure.
Face validity exampleYou’re interested in measuring participants’ weight in a medical trial.
You have thought of two methods of recording weight:
Participants stand on a scale, and you write down the number.
Participants self-report what they eat, and you estimate their weight.
Both methods have a very different level of face validity:
The first technique has high face validity because a scale is an appropriate instrument to measure weight.
The second technique has low face validity because you can’t deduce weight from information on what someone eats.
Face validity is typically evaluated by experts in the field, such as researchers or academics who have knowledge about the topic being studied. They review the instrument and assess whether it appears to measure the concepts or variables it claims to measure.
Published on
June 9, 2024
by
Julia Merkus, MA
Revised on
May 19, 2025
Ordinal data is categorized into ranks, with each category having a natural order. However, the spacing between these categories is not clearly uniform or quantifiable.
For instance, consider the variable “college degree,” which can be categorized into the following levels:
Associate degree
Bachelor’s degree
Master’s degree
Doctoral degree
While there is a clear hierarchical structure to these categories, we can’t claim that the difference between “associate degree” and “bachelor’s degree” is the exact same as the difference between “master’s degree” and “doctoral degree.” This lack of precise measurement makes this scale ordinal in nature.
Published on
June 9, 2024
by
Julia Merkus, MA
Revised on
May 19, 2025
Nominal data is a type of qualitative data that is characterized by its categorical nature. It is often used to describe characteristics or attributes of individuals, objects, or events, and it is typically represented as a label or category.
Nominal labels or categories don’t have an inherent rank or numerical value, which means you can’t logically order them. Researchers often use this type of data in conjunction with other types of quantitative data to provide a more complete understanding of a research question or problem.
Country of origin (e.g., Netherlands, China, Russia, Peru)
Colors (e.g., red, green, blue, purple, yellow)
Vehicle types (e.g., bus, truck, car, motorcycle)
The data for each of these variables can be categorized with labels, but there’s no inherent order to them. For instance, the labels for gender could be ranked in any random order.
Published on
June 9, 2024
by
Julia Merkus, MA
Revised on
May 19, 2025
An experimental design is a systematic plan for conducting an experiment that aims to test a hypothesis or answer a research question.
It involves manipulating one or more independent variables (IVs) and measuring their effect on one or more dependent variables (DVs) while controlling for other variables that could influence the outcome.
The goal of an experimental design is to isolate the effect of the independent variable on the dependent variable while controlling for other variables that could influence the outcome. By doing so, researchers can:
Test causal relationships between variables
Identify the effects of specific interventions or treatments
Make predictions about future outcomes
Your sample needs to be representative to draw valid conclusions from your data. If it’s unethical, hard, or even impossible to randomly assign participants to a control or treatment group, it’s best to use an observational design instead.
Published on
June 9, 2024
by
Julia Merkus, MA
Revised on
May 19, 2025
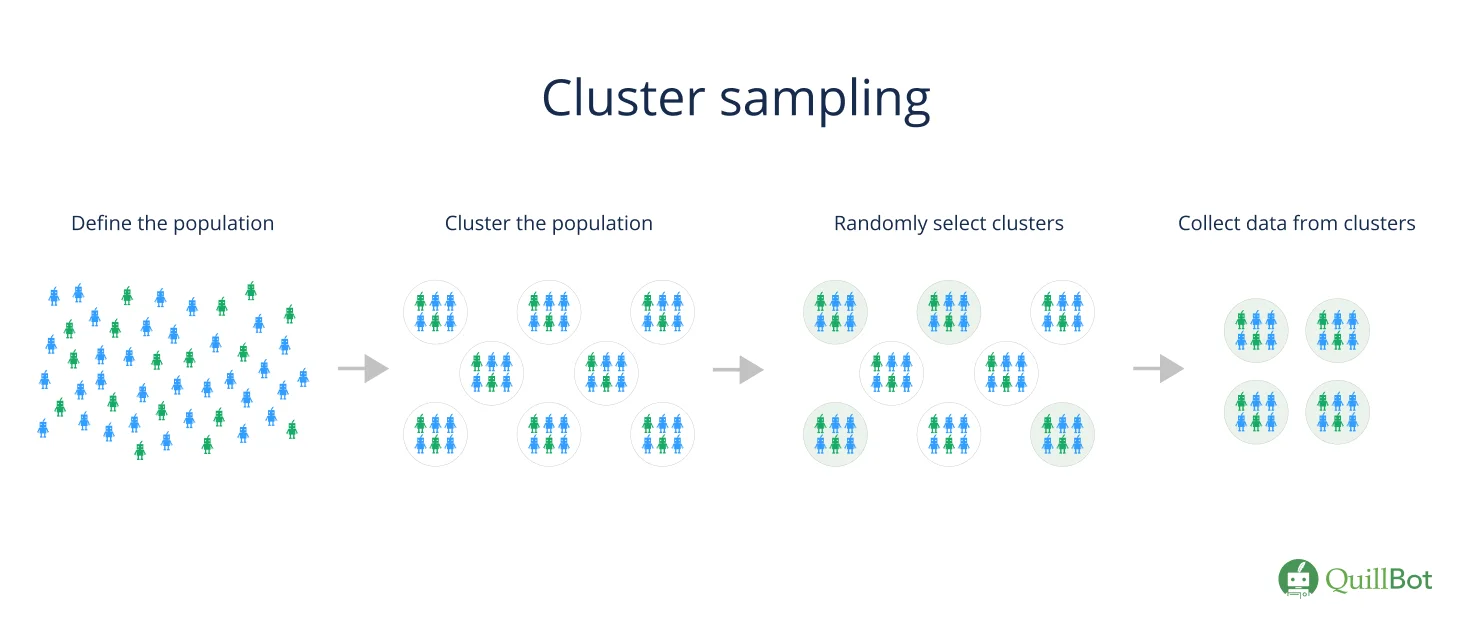
Cluster sampling is a probability sampling method where researchers divide a population into smaller groups called clusters. They then form a sample by randomly selecting clusters.
Cluster sampling is commonly used to study large populations, especially those with a wide geographic distribution. Researchers use existing groups or units (such as schools or towns) as their clusters.
Published on
June 9, 2024
by
Julia Merkus, MA
Revised on
May 19, 2025
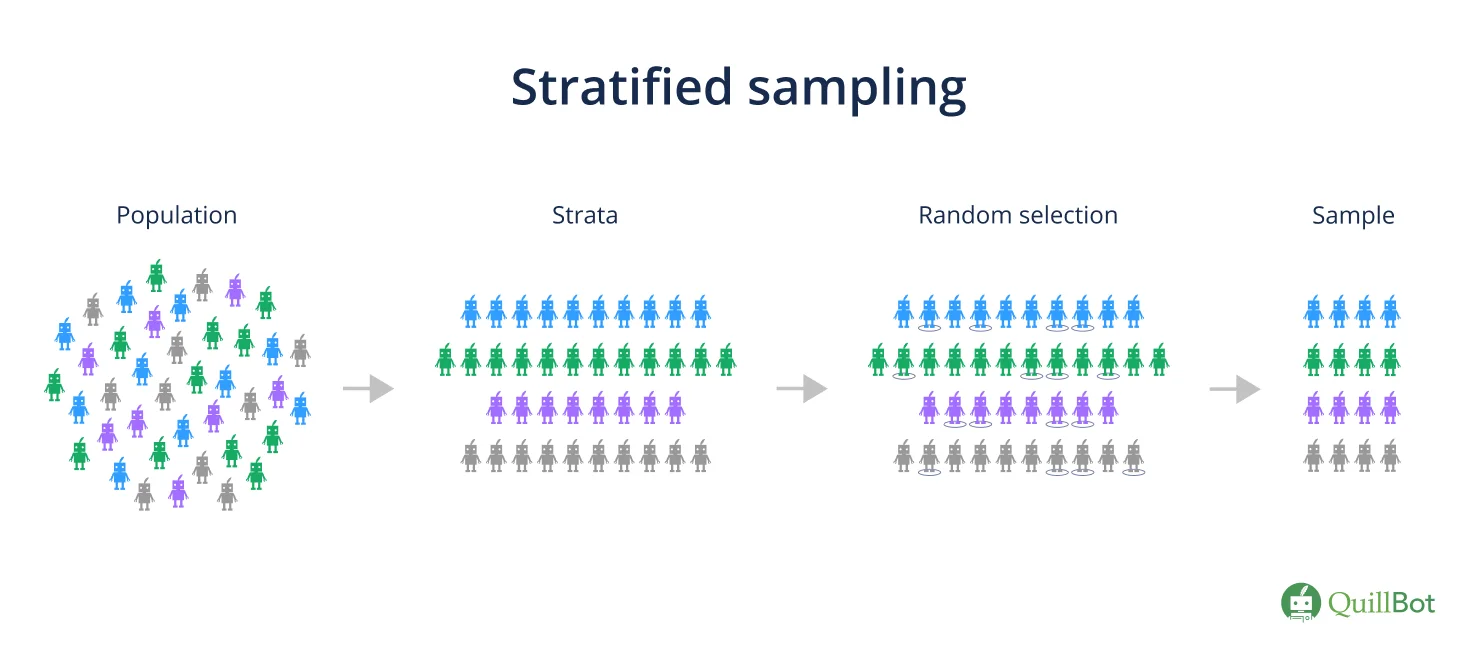
Stratified sampling is a probability sampling method where researchers divide a population into homogeneous subpopulations (strata) based on specific characteristics, such as gender, age, or socioeconomic status. Every member of the population should be in precisely one stratum.
Another sample is then drawn for each stratum using a different random sampling method (e.g., cluster sampling). This way, researchers can estimate statistics (e.g., averages) for each subpopulation.
Stratified sampling is used when the characteristics of a population vary and researchers need to make sure that the sample is representative of the entire population. This sampling method ensures high external validity and generalizability and minimizes the risk of some research biases.
Stratified sampling example A university wants to survey students about their satisfaction with campus facilities. The student population is diverse, including undergraduates, graduates, and doctoral students from various departments.
To ensure all groups are represented, the university decides to use stratified sampling based on academic level and department. They use a disproportionate sample to ensure the sample size of each subgroup is large enough to draw statistical conclusions.
Published on
June 9, 2024
by
Julia Merkus, MA
Revised on
May 19, 2025
In simple random sampling, every member of the population has an equal probability of being chosen for the sample.
This probability sampling method is the easiest to execute because it requires minimal prior knowledge about the population and it involves only one random selection.
The use of randomization ensures that the sample is representative of the population, with a reduced risk of biases such as sampling bias and selection bias. Additionally, the sample’s internal and external validity are likely to be high.
Simple random sampling exampleA university wants to conduct a survey to understand the opinions of its students about a new campus recreation center. The university has a population of 10,000 students. To conduct the survey, the researcher decides to use simple random sampling.
The researcher obtains a list of all 10,000 students. They use a random number generator to select a random sample of 500 students from the list. The random number generator assigns a unique number to each student in the list and then selects 500 numbers at random.
Every student has an equal chance of ending up in the sample.
Published on
June 9, 2024
by
Julia Merkus, MA
Revised on
May 19, 2025
Action research is a research method that combines investigation and intervention to solve a problem. Because of its interactive nature, action research is commonly used in the social sciences, particularly in educational contexts.
Educators frequently use this method as a means of structured inquiry, emphasizing reflective practice and combining theoretical knowledge and practical application.
The term “action research” was first introduced in 1944 by Kurt Lewin, a renowned MIT professor. Due to its cyclical nature, action research is also referred to as the action cycle, action model, or cycle of inquiry.
TipA generative AI tool, like AI Chat, can be helpful for brainstorming action research ideas and planning your research process.